What exactly is "paid search analytics?" It's the process of digging into your data to tell a story about what’s working with your PPC campaigns—and what's not. It's about tracking every click and every conversion so you can make smart, data-driven decisions that actually boost your return on investment (ROI). Good analytics tells a clear story about where your marketing dollars are going, what they're bringing back, and how you can rank your business higher.
Building Your Foundation for Accurate Paid Search Analytics

Before you can tell a powerful story with your data, you need to trust it. A solid analytics foundation isn't just a nice-to-have; it's the bedrock of any successful paid search strategy. Without it, you’re just throwing money into the wind and hoping for the best.
This is where we get our hands dirty. The goal is simple: make sure every single dollar you spend is accounted for, from the moment someone clicks your ad to the final sale. Getting this right gives you the confidence to know your data is clean, complete, and ready to guide your next move.
And the scale of this channel is just massive. Paid search is the dominant force in digital advertising, with global spending projected to blow past $300 billion in 2025. This explosive growth is happening for a reason—it works. It drives qualified traffic and delivers measurable returns for businesses of all shapes and sizes. For a closer look at the trends driving this, Salesforce has some great insights.
Implementing Essential Tracking Pixels
First thing's first: you need tracking pixels. These are tiny snippets of code you place on your website that fire off whenever a user does something important, like buying a product or filling out a form. That information gets sent straight back to the ad platform.
Think of pixels as digital informants. They tell you the final chapter of a customer's journey. For anyone running ads on Google or Meta, the Google Ads conversion pixel and the Meta (Facebook) pixel are completely non-negotiable. They do more than just count conversions; they feed the crucial data that automated bidding strategies need to find more of those valuable customers.
Mastering UTM Parameters for Granular Insights
While pixels tell you what happened, UTM parameters tell you how it happened. These are simple tags you add to the end of your URLs to identify the source, medium, and campaign that sent the traffic your way.
A well-organized UTM strategy is the difference between knowing "Google CPC" brought you a sale and knowing that your "emergency plumbing services" ad group in Dallas is your absolute top performer. It lets you see exactly which ad creative or keyword is doing the heavy lifting, providing direct insights for your SEO and local (GEO) ranking efforts.
Here’s a practical breakdown of what that looks like:
utm_source=google(This tells you the traffic came from Google)utm_medium=cpc(Specifies it was a paid click)utm_campaign=winter_promo(Names the exact campaign)utm_term=24-hour_plumber(Tracks the specific keyword clicked)utm_content=blue_ad_variant(Differentiates between ad versions)
This level of detail is gold. It’s how you optimize your budget and understand which messages truly connect with your audience. If you want to get deeper into campaign structure, our guide on building an effective PPC strategy is a great next step.
When to Consider Server-Side Tagging
In a world where privacy is king, traditional browser-based tracking is running into some serious roadblocks from ad blockers and cookie restrictions. This is where server-side tagging comes in. It offers a much more durable and accurate solution by moving the tracking logic from the user's browser to your own secure server.
This approach is a game-changer for data accuracy because it bypasses many of the interruptions that happen on the client's side. It also puts you in the driver's seat, giving you more control over what data you share with third-party platforms.
For any business with a complex conversion funnel or those in industries with strict privacy rules, switching to a server-side setup is quickly becoming a strategic necessity. It’s the difference between an educated guess and an exact accounting of your performance.
Unifying Google Ads and GA4 for Deeper Insights

Running Google Ads without a direct line into your analytics is like trying to navigate a new city with a map that only shows the major highways. You can see the main routes, sure, but you have no idea what’s happening on the neighborhood streets where your customers actually live.
Integrating Google Ads with Google Analytics 4 (GA4) is how you connect those missing streets. It gives you a complete, door-to-door view of the customer journey, from the first ad click to the final conversion.
This connection isn’t just a nice-to-have; it's a foundational step for building a serious paid search analytics engine. By linking the two platforms, you stop looking at ad performance in a vacuum and start seeing exactly how those clicks translate into real, meaningful behavior on your website.
The Immediate Wins of Linking Your Accounts
The moment you link your Google Ads and GA4 accounts, a whole new world of capabilities opens up. This isn't just about pushing data from one place to another. You’re creating a two-way street where insights from one platform directly fuel optimizations in the other.
Right away, you can start importing valuable GA4 conversions directly into Google Ads. Think about it: maybe your most important user action isn't a simple purchase. Maybe it's a user who watches a demo video and then downloads a whitepaper. In GA4, you can define this multi-step action as a single conversion event and then use it to train your Google Ads bidding algorithms.
This direct import is an absolute game-changer for smart bidding. Instead of optimizing for a generic "lead," you're telling Google’s AI to find more people who act like your most qualified prospects. The result is higher-quality traffic and a much more efficient ad spend.
Building and Sharing Intelligent Audiences
Beyond simple conversion tracking, the real magic of this integration comes from audience sharing. This feature lets you build incredibly specific audience segments in GA4 based on actual user behavior and then port them over to Google Ads for hyper-targeted remarketing.
This is where things get really strategic. You're no longer stuck with basic remarketing lists like "all website visitors." Instead, you can create dynamic audiences that tell a much richer story about a user's intent and even their physical location, which is crucial for GEO (Geographic Search Optimization).
For a local service business, like an HVAC company, the possibilities are huge:
- High-Intent Locals: You could build an audience of users within a 15-mile radius who visited your "AC Repair" page more than twice but never filled out a form. Then, you can hit them with a targeted Google Ad offering "Same-Day AC Service in Your Area."
- Smart Upsells: You could create a list of customers who bought a new furnace in the last six months and serve them ads for a discounted pre-summer AC tune-up. It's a perfect way to increase their lifetime value.
- Abandoned Carts: An ecommerce store can segment users who added a specific high-value item to their cart but bailed before checkout. A quick remarketing campaign featuring that exact product can be just the nudge they need.
This level of detail turns your analytics paid search strategy from a blunt instrument into a surgical tool. You're not just blasting out ads; you're continuing a conversation with potential customers based on what they've already shown you they're interested in. This is how you finally connect the first click to the final sale and understand the true impact your ads are having on the business.
Choosing KPIs That Tell Your Business Story
Clicks and impressions are vanity metrics. They look good on a report, but they don't help you rank better or pay the bills. The real meat of paid search analytics is found in the Key Performance Indicators (KPIs) that are directly wired to the health of your business. These are the numbers that tell a compelling story about whether your ad spend is actually fueling growth or just making a lot of noise.
You have to move past the surface-level data. Think of it like this: a campaign might pull in thousands of clicks, which seems great. But if none of those clicks become profitable customers, it's a failed campaign. Simple as that. Picking the right KPIs is how you start telling a better story with your data.
Beyond ROAS: The Three Pillars of Profitability
Return on Ad Spend (ROAS) gets a lot of attention, but on its own, it only shows you a sliver of the picture. To get a true handle on performance, you need to look at a trio of interconnected KPIs: Customer Acquisition Cost (CAC), Lifetime Value (LTV), and, yes, ROAS.
Relying on just one of these can be dangerously misleading. A high ROAS might make you feel like you're crushing it, but if your CAC is higher than what a customer is actually worth to you over time (their LTV), you’re literally paying to lose money.
Customer Acquisition Cost (CAC)
Customer Acquisition Cost (CAC) is exactly what it says on the tin—it's the total cost you pay to land a single new customer. The math is straightforward: divide your total ad spend by the number of new customers you got from those ads.
CAC = Total Ad Spend / Number of New Customers
Let's imagine a local roofing company spends $5,000 on Google Ads in a month and signs 10 new roof replacement contracts as a direct result. Their CAC is $500. Knowing this number is the critical first step to figuring out if their advertising is actually profitable.
A low CAC isn't automatically the goal. The real question is whether your CAC is sustainable. If that roofer's average job profit is $4,000, a $500 acquisition cost is a fantastic investment. But if they were selling a $300 service, they’d be in serious trouble.
Return on Ad Spend (ROAS)
Return on Ad Spend (ROAS) measures the gross revenue you generate for every single dollar you spend on ads. It's a quick and easy way to gauge campaign efficiency and is a favorite metric for ecommerce brands for a reason.
ROAS = Total Revenue from Ads / Total Ad Spend
Picture an online shoe store that spends $1,000 on a Shopping campaign and brings in $4,000 in sales. Their ROAS is 4x, or 400%. This means for every dollar they put into the machine, they got four dollars back in revenue. It's a powerful metric for quickly comparing the performance of different campaigns or ad groups side-by-side.
But ROAS has a blind spot: it completely ignores profit margins. A 4x ROAS on a high-margin product is incredible. That same 4x ROAS on a low-margin item might not even be breaking even.
Lifetime Value (LTV)
This is the metric that separates short-term thinking from long-term, sustainable strategy. Lifetime Value (LTV) is a prediction of the total net profit you can expect from a single customer over their entire relationship with your business.
Calculating LTV can get complicated, but here’s a simplified version to get you started:
LTV = (Average Purchase Value) x (Average Purchase Frequency) x (Average Customer Lifespan)
For a subscription box service, if a customer pays $50/month and sticks around for an average of 12 months, the LTV is $600. This completely reframes how you look at your CAC. Suddenly, paying $100 to acquire that customer seems like an amazing deal, even if their very first purchase was only $50.
Focusing on LTV helps you make much smarter decisions about where to put your paid search budget. It gives you the confidence to spend more to acquire customers who are likely to stick around and make repeat purchases—and that’s the secret to building a truly scalable business.
Essential Paid Search KPIs and Their Business Impact
To help you connect these metrics to real-world decisions, here’s a quick-reference table. These are the KPIs that move the needle and help you answer the tough questions about your marketing performance.
| KPI | What It Measures | Simplified Formula | Strategic Question It Answers |
|---|---|---|---|
| Customer Acquisition Cost (CAC) | The total cost to acquire one new paying customer through advertising. | Total Ad Spend / New Customers Acquired |
"Is our cost to get a new customer sustainable for our business model?" |
| Return on Ad Spend (ROAS) | The gross revenue generated for every dollar spent on ads. | Revenue from Ads / Total Ad Spend |
"Which of our campaigns are the most efficient at generating immediate revenue?" |
| Lifetime Value (LTV) | The total predicted net profit a customer will generate over their entire relationship. | (Avg. Purchase Value) x (Avg. Purchase Frequency) x (Avg. Customer Lifespan) |
"How much should we be willing to spend to acquire customers who will be profitable long-term?" |
| LTV:CAC Ratio | The relationship between the lifetime value of a customer and the cost to acquire them. | LTV / CAC |
"Are we generating long-term value from our ad spend? (A 3:1 ratio is a common benchmark.)" |
Ultimately, the goal is to create a profitable feedback loop. By tracking this trio of KPIs, you can see not just what’s working right now, but what is building a foundation for future growth.
Decoding Attribution and Customer Conversion Paths
The path a customer takes from their first click to a final purchase is rarely a straight line. It's usually a winding journey, weaving through multiple searches, ad interactions, and website visits. Decoding this journey is the core challenge of attribution—giving credit where credit is due for all the touchpoints that led to a sale.
For far too long, the industry has leaned on the Last Click model. It's simple: 100% of the credit goes to the very last interaction a customer had before converting. But simplicity comes at a cost. This model tells a dangerously incomplete story, totally ignoring all the earlier touchpoints that introduced someone to your brand and nurtured their interest along the way.
Moving Beyond the Last Click Default
Imagine a common scenario for a local business. A potential customer starts by searching for a generic term like "best running shoes." They click your Shopping ad, browse for a bit, but don't buy. A few days later, they see one of your remarketing ads on a news site, which jogs their memory. Finally, a week later, they search for your brand name directly, click your branded search ad, and make a purchase.
Under a Last Click model, that branded search ad gets all the glory. But was it really the only thing that drove the sale? Of course not. The initial Shopping ad and the remarketing ad were crucial assists. Moving to a more sophisticated attribution model is how you start to finally see and value these "assists."
Exploring Smarter Attribution Models
Fortunately, both Google Ads and GA4 offer more nuanced models that paint a much more accurate picture of your performance. These models distribute credit more intelligently across the entire conversion path.
- Time Decay: This model gives more credit to touchpoints that happened closer in time to the conversion. It’s useful if your sales cycle is short, as it still values early interactions but gives the most weight to the final ones.
- Data-Driven: This is the real game-changer. It uses your account’s historical conversion data and machine learning to figure out exactly how much credit each touchpoint deserves. It’s not based on a fixed rule; it’s custom-tailored to your business and how your customers actually behave.
Switching from Last Click to a Data-Driven model can completely change the story your analytics tells. You might discover that your generic, top-of-funnel campaigns are far more valuable than you realized because they consistently start the journeys that your branded campaigns are closing. You can discover more advanced strategies for your campaigns in our guide to modern PPC.
This visual map shows just how interconnected core KPIs like CAC, ROAS, and LTV really are.
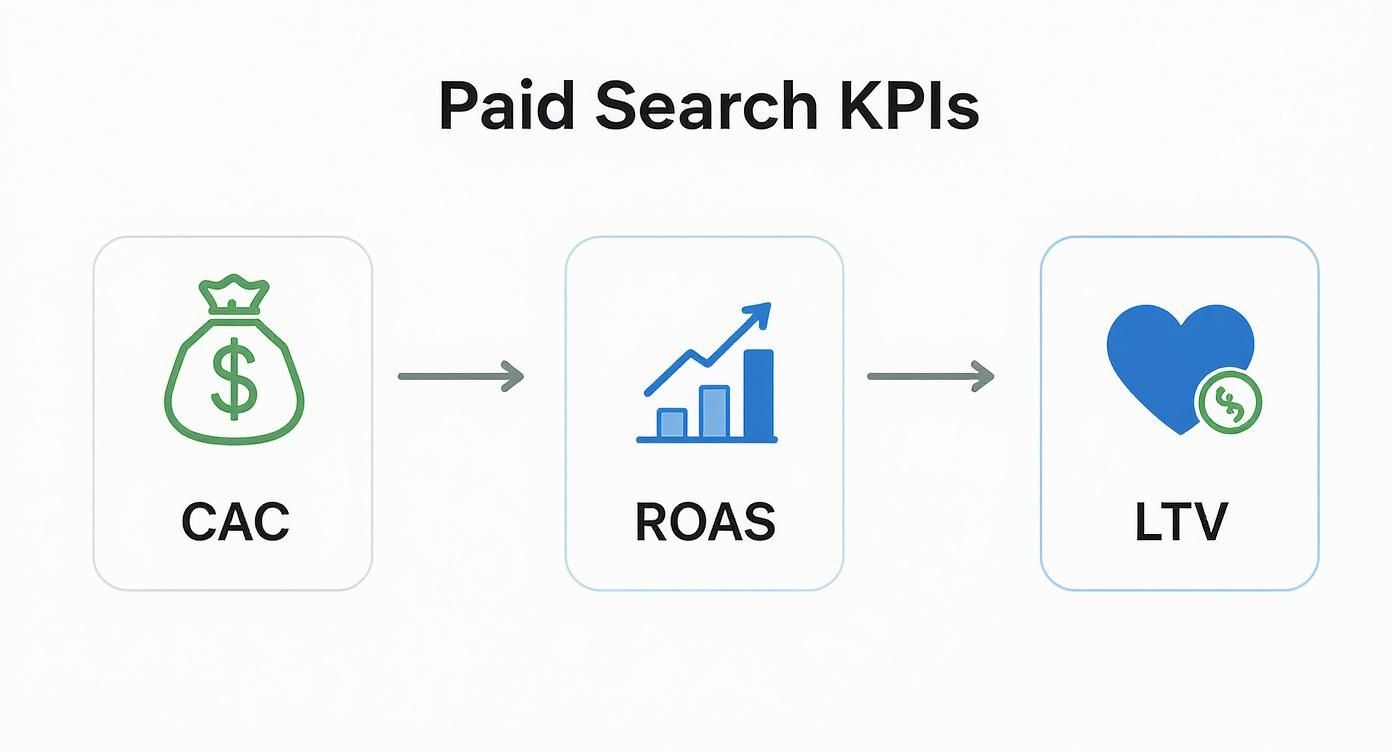
Understanding these connections is vital. Your choice of attribution model directly impacts how you calculate the ROAS and CAC of individual channels, which in turn influences where you put your budget.
Analyzing Conversion Paths for a Holistic Strategy
By digging into the conversion path reports in GA4, you can identify which channels are your best openers, closers, and assists. This insight lets you build a truly complete paid search strategy where every campaign has a clear, defined role.
Paid search has a massive economic impact because it taps directly into consumer behavior. The data backs this up. Research shows 70% of people are more likely to buy after being retargeted, highlighting the power of these multi-touch journeys. On top of that, 46% of Google searches have local intent, and a staggering 76% of those searchers visit a nearby business within a day, proving paid search drives real-world action and is critical for GEO success.
By understanding the full path, you can justify spending on awareness-building campaigns that may not have a high direct ROAS but are essential for filling the top of your funnel. It’s the difference between managing individual campaigns and orchestrating a revenue-generating system.
Turning Data into Decisions with Actionable Dashboards
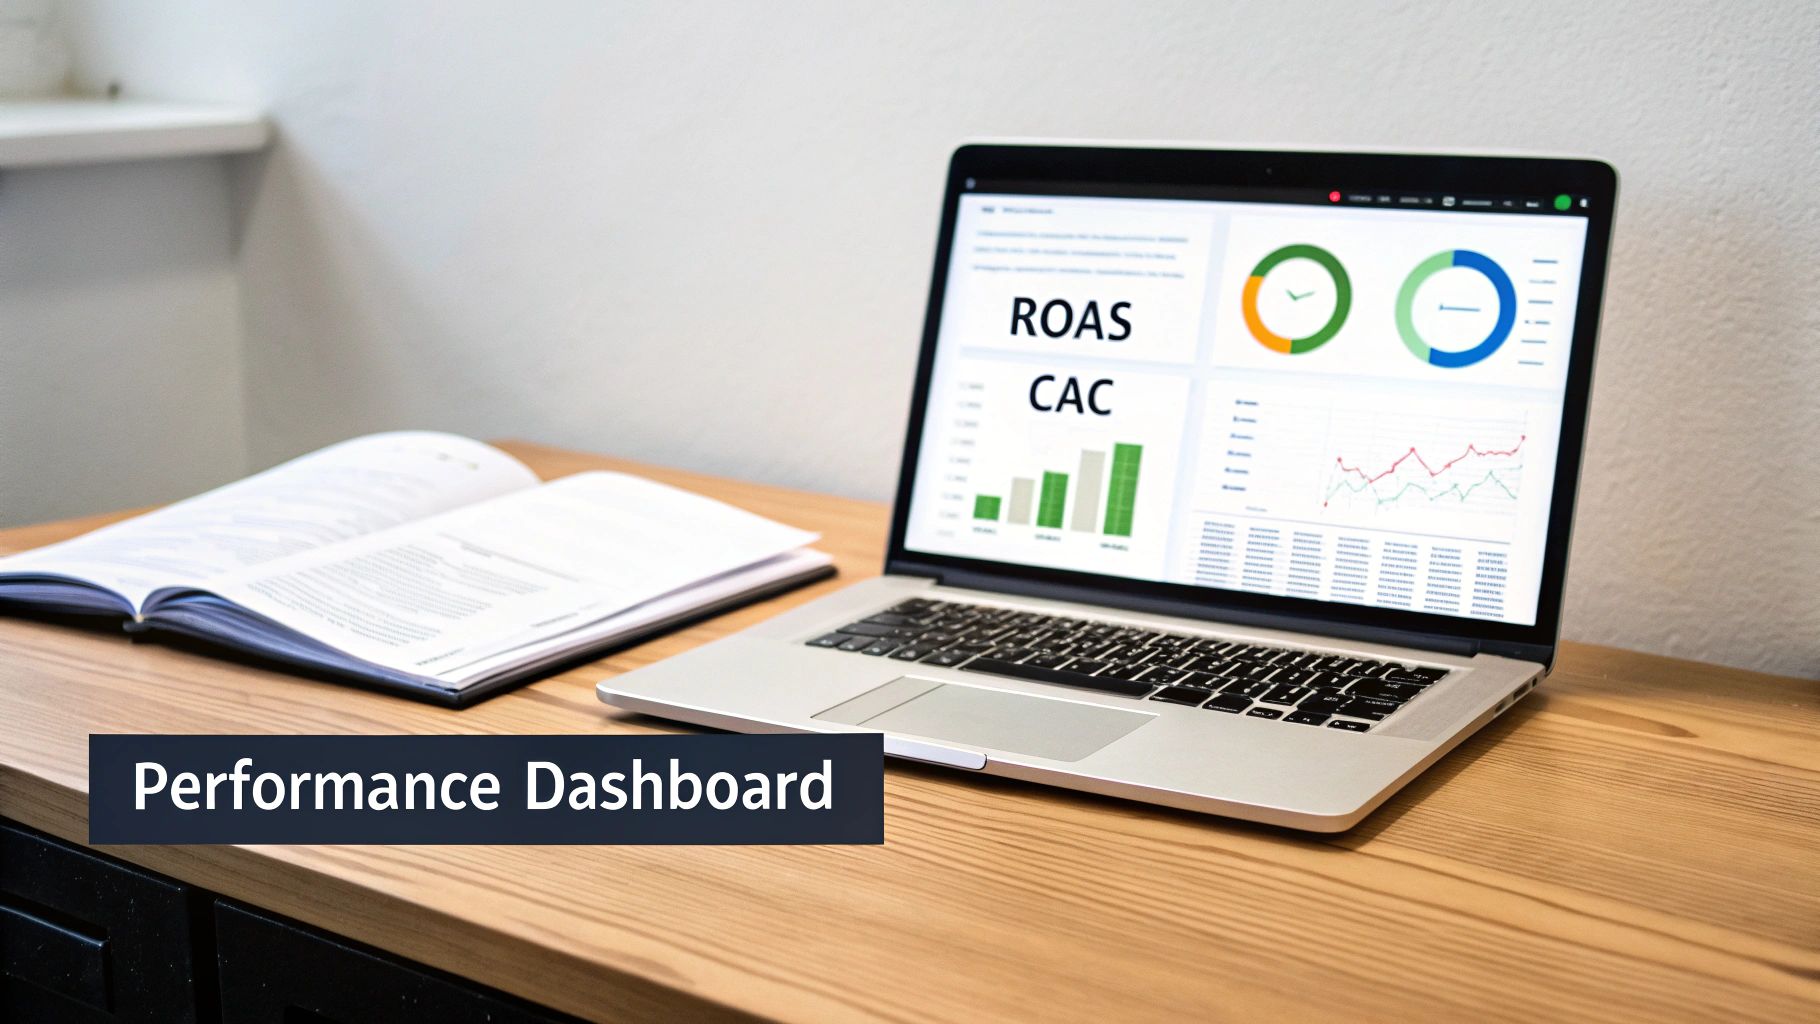
Let's be honest: raw data is just noise. Your analytics platform is probably sitting on a mountain of numbers, but without context and interpretation, they’re basically meaningless. The real magic happens when you transform that data into a clear, compelling story that actually drives decisions. That’s where a good dashboard comes in.
A well-built dashboard does more than just show you what happened last week. It tells you why it matters and points you toward what to do next. It’s the bridge between complex paid search analytics and smart business strategy, making sure everyone from the CEO to the campaign manager is on the same page.
One Size Doesn't Fit All: Tailoring Dashboards for Your Audience
Not everyone in your company needs—or wants—the same firehose of data. Your CEO doesn't have time to get lost in ad group performance, and a PPC manager can’t do their job with just a high-level ROAS figure. Building dashboards for specific audiences is absolutely critical.
Think of it as creating different lenses for different roles:
- The Executive Dashboard (CEO/CMO): This is the 10,000-foot view. Keep it clean, highly visual, and focused strictly on the metrics that impact the bottom line. It’s all about answering the big questions: Are we growing? Are we profitable?
- The Manager Dashboard (PPC Specialist): This is the deep dive—the command center. It needs to be granular, tactical, and built for day-to-day optimization. This is where you track campaign, ad group, and keyword performance to spot what to fix, what to scale, and what to test next.
Here’s a quick breakdown of what each view might look like:
| Dashboard View | Key Metrics | Primary Goal |
|---|---|---|
| Executive View | Overall ROAS, Total Lead/Sale Volume, CAC, LTV:CAC Ratio | Quickly assess business impact and profitability. |
| Manager View | CTR, CPC, Conversion Rate, Impression Share, Quality Score | Pinpoint optimization opportunities and troubleshoot issues. |
When you segment your reporting like this, every stakeholder gets exactly the intel they need to make decisions. It also creates a culture of accountability where everyone understands how their piece of the puzzle contributes to the bigger picture.
Building Your Performance Hub in Looker Studio
Tools like Looker Studio (what we used to call Google Data Studio) are perfect for this. You can create dynamic, shareable reports that connect directly to your data sources like Google Analytics and Google Ads. The best part? The data is live, so your dashboards are always up-to-date.
A high-impact dashboard should tell a story, flowing logically from top to bottom. I always put the most important, high-level KPIs right at the top—things like total spend, revenue, and ROAS. As you scroll down, you can get more granular with charts breaking down campaign performance, keyword trends, and device splits.
Your dashboard should answer questions, not just present data. Instead of a boring table of keywords, try a scatter plot showing the relationship between a keyword's cost-per-conversion and its total conversion volume. This instantly shows you which keywords are your efficient workhorses and which ones are just burning cash.
Put Your Reporting on Autopilot
The final piece is getting these insights into people's hands consistently. Manually pulling and sending reports is a huge time-sink and a recipe for inconsistency. Set up automated email reports directly from your dashboarding tool.
This simple step creates a reliable rhythm of communication. Key stakeholders will see performance data at regular intervals—daily, weekly, or monthly—without you having to lift a finger. It keeps paid search top-of-mind and builds trust through transparent, consistent updates. Our smart home case study is a great example of how consistent reporting helps align strategy and prove value over the long haul.
As the industry moves away from third-party cookies, having a solid analytics and reporting foundation built on first-party data is more important than ever. By mastering your dashboards now, you’re creating a single source of truth that will guide your strategy through any shift the industry throws at you.
Got Questions About Paid Search Analytics? We've Got Answers.
Diving into the world of paid search analytics can feel a bit like learning a new language. You're swimming in data, but what does it all actually mean for your business? Let's clear up some of the most common and pressing questions marketers have when trying to connect ad spend to real-world results.
My goal here is to give you straightforward, no-fluff answers you can put into practice right away. Think of this as your go-to guide for getting over the most common analytics hurdles.
"How Long Should I Run a Campaign Before Making Decisions?"
This is the classic question, and the only honest answer is: it depends. There’s no magic number. You absolutely have to wait long enough to gather statistically significant data. Making a big call based on a day or two of performance is like judging a movie by its opening credits—you’re missing the entire story.
For most businesses I've worked with, a good rule of thumb is to let a new campaign run for at least one to two full buying cycles. If your customers usually take about a week to decide on a purchase, running your test for a minimum of two weeks is a solid baseline. This helps smooth out the random daily ups and downs and gives you a much more reliable picture of how things are really going.
A crucial tip: wait for your campaigns to exit the "learning phase" on platforms like Google Ads. This can last up to a week, and during this time, the algorithm is just figuring things out. Making drastic changes too early just resets the clock and keeps you from ever seeing what the campaign is truly capable of.
"What Is a Good ROAS or CAC?"
Another big one. The truth is, a "good" ROAS or CAC is completely relative to your business model—specifically, your profit margins. A 3x ROAS (that's 300%) might be incredible for a company with a juicy 60% profit margin, but it could be a complete money-loser for a business with only a 20% margin.
Stop chasing vague industry benchmarks and start focusing on your own numbers.
- Calculate Your Break-Even ROAS: First, you need to know your profit margin. If you have a 40% margin, your break-even ROAS is 2.5x (
1 / 0.40). Anything you make above that number is pure profit. - Determine Your LTV:CAC Ratio: As we covered earlier, the relationship between Lifetime Value (LTV) and Customer Acquisition Cost (CAC) is a far better health indicator for the long haul. A ratio of 3:1 (meaning a customer is worth three times what it cost you to get them) is a widely accepted benchmark for sustainable growth.
The goal isn't to hit some generic number you read in a blog post; it's to build a system that's actually profitable for your business.
"Can Paid Search Analytics Help with My Local SEO?"
Absolutely. In fact, your paid search data is a goldmine for your local SEO and GEO (Geographic Search Optimization) strategy. The immediate feedback you get from PPC helps you quickly figure out what clicks with your local audience, which you can then apply to your slower-burn organic efforts to rank higher.
Think about the stories your PPC data is telling you:
- Keyword Discovery: Your search term reports in Google Ads show you the exact phrases local customers are typing in. You might find out they're searching for "24-hour AC repair near me" way more than "emergency air conditioning." That's invaluable intelligence for your on-page SEO.
- Ad Copy Insights: A/B testing your ad copy can reveal which selling points (like "Same-Day Service" or "Free Estimates") get the most clicks in your service area. Take that winning language and use it in your website's meta titles, descriptions, and page headers.
- Location Performance: You can see which specific zip codes, cities, or neighborhoods are driving the most conversions. This tells you exactly where to focus your Google Business Profile optimization and local content creation.
Using paid search as a testing ground lets you make much smarter, data-backed decisions for your organic local rankings.
"Why Do Google Ads and GA4 Show Different Conversion Numbers?"
This is a super common point of confusion that can make you question your entire setup. Don't worry, your tracking probably isn't broken. The difference almost always comes down to two things: attribution models and conversion counting.
By default, Google Ads often gives conversion credit to the date of the ad click. Google Analytics 4 (GA4), on the other hand, attributes it to the date the conversion actually happened.
Here’s a quick scenario: Someone clicks your ad on Monday but doesn't buy until Wednesday. Google Ads might report a conversion for Monday, while GA4 reports it for Wednesday. Same conversion, different dates.
On top of that, the attribution models themselves might be different. Your Google Ads account could be using a "Data-Driven" model while your GA4 property is on "Last Click." This will naturally cause discrepancies. The fix is to get your attribution settings as consistent as you can across both platforms.
Ready to turn your paid search data into a powerful growth engine? Jackson Digital builds custom strategies that connect every click to your bottom line, using robust analytics to drive predictable leads and sales. Let's tell your brand's story together. Request a free performance audit on jackson-digital.com.
Article created using Outrank