Too many people think of paid search as just buying clicks. The real power, though, is in fueling predictable business growth and telling a compelling story about your brand's journey online. The secret is using paid search analytics to draw a straight line from every dollar you spend to real-world outcomes like ranking higher, attracting local customers, and ultimately, driving sales. This guide is all about getting you out of confusing spreadsheets and showing you how to turn raw data into a narrative that drives your business forward.
Beyond Clicks: Turning Paid Search Analytics Into Revenue

It’s easy to get stuck measuring the wrong things. Many businesses pat themselves on the back for high click-through rates (CTR) or a low cost-per-click (CPC), all while having no idea if those clicks ever turn into paying customers. This obsession with "vanity metrics" is a fast way to burn through your marketing budget with very little to show for it in search engine rankings or sales.
Making the leap from vanity metrics to genuinely useful insights starts with one simple question: "What is this ad campaign actually supposed to do for the business?" For a local service company, the goal might be getting qualified phone calls (GEO targeting). For an e-commerce store, it’s all about driving online sales (SEO and AEO). Good paid search analytics is the bridge that connects your ad spend to these bottom-line results.
Let's look at the journey of a local plumbing company. They were dumping thousands every month into Google Ads and getting plenty of clicks, but the leads were all over the place. Their marketing felt like a slot machine—some months were great, others were a total bust. They had no idea where their next job was coming from or how their ads were impacting their local search presence.
From Unpredictable Leads to a Reliable Sales Pipeline
The game changed when they finally started digging into their paid search analytics. Instead of just glancing at clicks, they began tracking which specific keywords and ads were actually leading to booked appointments. This deeper dive uncovered a crucial insight: keywords like "emergency plumber near me" converted at a rate 3x higher than broader, more generic terms like "plumbing services." This was their first clue to unlocking powerful geo-targeting (GEO).
That one data point changed everything. They immediately shifted their budget to those high-intent, local keywords, rewrote their ad copy to speak directly to someone in a neighborhood panic, and made sure their landing page was built for one thing: getting a frantic homeowner on the phone, fast. This told a powerful story: "We are the local expert, here for you right now."
By focusing on conversion data, the plumbing company transformed its advertising from a cost center into a predictable sales engine. They could now confidently invest more into paid search, knowing exactly how many local leads—and how much revenue—each dollar would bring back.
This is what paid search analytics is all about. It's not about spitting out numbers for a report; it’s about finding the story in the data that leads to smarter business decisions and better search engine visibility. This framework helps you map out the entire customer journey, from the moment they type in a search query to the final sale.
Once you master this, you can:
- Slash your customer acquisition costs by putting money only on what works.
- Boost your profitability by zeroing in on the most valuable, high-intent searches.
- Carve out a competitive edge in your local market (GEO) and beyond (SEO).
- Figure out long-term profitability by understanding what your customers are really worth over time. This is a critical piece of the puzzle, and you can learn more by checking out different approaches for a proper customer lifetime value calculation.
Building Your Analytics Foundation with Proper Tracking
![]()
Before you can pull a single useful insight from your paid search data, you have to be able to trust that data in the first place. Think of your tracking setup like the foundation of a house. If it’s cracked and unstable, everything you build on top of it is going to come crashing down. Weak tracking leads directly to flawed analysis, wasted ad spend, and a ton of missed opportunities to improve your search engine performance.
Building this foundation isn't about becoming a coding expert overnight. It’s simply about putting a solid system in place that reliably captures the actions that actually matter to your business. This is how you ensure every decision is based on clean, accurate information—not just a gut feeling.
The Role of Google Tag Manager
One of the best tools for pouring that solid foundation is Google Tag Manager (GTM). Imagine GTM as a digital toolbox that holds all your different tracking codes—like your Google Analytics tag, conversion pixels, and remarketing tags—all in one tidy, organized place.
Instead of bugging a developer to add new tracking scripts to your website’s code every time you need something, you can manage it all yourself through GTM’s straightforward interface. This is a huge deal for businesses. A local dental practice can instantly set up tracking for every time someone clicks the "Book an Appointment" button. A construction company can track "Request a Quote" form submissions without touching a single line of code. This control keeps you agile and makes sure you’re measuring what truly moves the needle.
Defining What Matters with GA4 Conversions
Once GTM is in place, your next job is to tell Google Analytics 4 (GA4) what a "win" actually looks like for you. These are your conversion actions. A conversion isn’t always just a sale; it's any valuable action a user takes on your website that shows they're interested in your answer to their query.
Here are a few common examples of crucial conversion actions:
- Form Submissions: A user fills out your contact form to get more information.
- Phone Calls: A visitor clicks on your phone number to call your office right from an ad.
- Key Page Views: A potential customer checks out your pricing or a specific service page.
- Downloads: Someone downloads a PDF guide or case study, signaling strong buying intent.
By setting these up as official conversion events in GA4, you’re essentially telling the platform, "Hey, these are the actions that eventually lead to revenue." That data then gets piped directly into Google Ads, letting you optimize your campaigns not just for clicks, but for real business results that improve your overall ranking story.
Without proper conversion tracking, you’re flying blind. You might be burning money on keywords that generate a lot of traffic but never produce a single qualified lead. Accurate tracking shines a light on what's working so you can invest your budget with confidence.
Unlocking Clarity with UTM Parameters
Finally, let's talk about UTM parameters. The easiest way to think of them is as little GPS coordinates for your website traffic. They're just simple tags you add to the end of your URLs that tell Google Analytics exactly where a user came from.
This is absolutely critical for paid search because it lets you see which specific campaigns, ad groups, and even individual ads are driving your conversions. To get your analytics foundation right, make sure you're consistently using UTM parameters for Google Analytics to track every paid campaign. This is the level of detail that shows you one ad variation is outperforming another by 50%, empowering you to make smart, data-backed calls.
The paid search world is as healthy as ever, and precise tracking is how you capitalize on it. Recent benchmarks show conversion rates are up 6.84% year-over-year, which just goes to show the opportunity waiting for businesses that measure their performance correctly. When you consider that most first-time visitors don't convert right away, this kind of meticulous tracking becomes essential for your remarketing efforts to guide them back to finish a purchase or inquiry.
Decoding the Metrics That Actually Drive Your Business
Once you have a solid tracking foundation, you can finally start turning all those raw numbers into a clear, compelling story about performance. The world of paid search is drowning in dozens of metrics, but here's the secret: not all of them are created equal.
Learning to tell the difference between what looks good and what actually grows the business is the single most important skill you can develop. It's about focusing on metrics that not only show ad performance but also reflect your business's health in search engine results. This is the classic battle between "vanity metrics" and "sanity metrics."
Vanity metrics, like impressions and clicks, feel good to put in a report but often say very little about your bottom line. Sanity metrics, on the other hand, are the numbers that connect directly to your bank account—they keep your business healthy and your strategy grounded in reality.
The Danger of Chasing Vanity Metrics
Let me tell you a quick story about a tech startup I worked with years ago. They had just closed a fresh round of funding and were determined to make a huge splash with Google Ads. Their marketing lead was completely obsessed with one metric above all others: Click-Through Rate (CTR).
Every week, the team celebrated as they tweaked ad copy and watched their CTR climb higher and higher. They were getting a ton of traffic, and on paper, the campaigns looked like a massive success.
But a few months in, the founders noticed something terrifying. Their bank account was draining fast, but their customer base wasn't growing at anywhere near the same rate. They were spending a fortune to acquire traffic that just wasn't converting. The story their data told was one of popularity, not profitability.
The startup nearly burned through its entire funding round because they were chasing a vanity metric instead of asking the one question that mattered: "How much does it cost us to get a new paying customer?"
This story is a perfect example of why focusing on bottom-line results is non-negotiable. High traffic and impressive click rates are worthless if they don't translate into profitable customer acquisition. Your sanity metrics are your guardrails against wasteful spending.
To help you stay focused, here's a quick way to separate the noise from the signals.
Key Paid Search Metrics Vanity vs Sanity
| Metric Category | Vanity Metric (What it looks like) | Sanity Metric (What it really means for your business) |
|---|---|---|
| Awareness | Impressions: How many people saw your ad. It feels big, but shows no intent. | Impression Share: What percentage of available ad slots are you capturing? This shows competitive presence and ranking potential. |
| Engagement | Click-Through Rate (CTR): Your ad copy is catchy! But are the right people clicking? | Conversion Rate: What percentage of those clicks actually turned into leads or sales? This is where the money is. |
| Cost | Cost-Per-Click (CPC): How much you pay for a single click. Cheaper isn't always better. | Cost Per Acquisition (CPA): How much did you spend to get one new customer? This is the true cost of your marketing. |
| Profitability | Clicks: Lots of website visitors! It looks busy, but traffic doesn't pay the bills. | Return On Ad Spend (ROAS): For every dollar you put into ads, how many dollars did you get back? The ultimate measure of success. |
Think of this table as your gut check. When you're reviewing campaign performance, always ask if you're looking at a vanity number or a sanity number.
Building Your Hierarchy of Paid Search KPIs
To avoid the startup's trap, you need a clear hierarchy for your Key Performance Indicators (KPIs). The easiest way to think about it is like a pyramid. At the wide base, you have your top-of-funnel indicators. As you move up toward the point, the metrics get closer and closer to actual revenue.
Here’s a simple way to structure your paid search analytics:
-
Top-Funnel Indicators (The 'Health' Metrics): These numbers tell you if your campaigns are set up correctly and reaching the right audience. Think Quality Score, which is Google's rating of your ad relevance, and Impression Share, which shows how often your ads appear compared to how often they could have. These directly relate to your SEO and GEO ranking potential.
-
Mid-Funnel Indicators (The 'Engagement' Metrics): Now we're getting to metrics like CTR and Cost-Per-Click (CPC). These are important for diagnosing ad performance, but they should never be your ultimate goal. They tell you if your ad copy is compelling, not if you're making money.
-
Bottom-Funnel Drivers (The 'Sanity' Metrics): This is the very top of the pyramid—the metrics that truly matter. This is where you find Conversion Rate, Cost Per Acquisition (CPA), and Return On Ad Spend (ROAS). These KPIs tell you exactly how efficiently your ad spend is turning into leads and sales.
Understanding these sanity metrics is absolutely crucial. CPA, in particular, helps you keep your growth sustainable. To get a handle on this critical number, it’s helpful to use a tool to figure out what you can afford to spend; you can easily figure out your target CPA with a customer acquisition cost calculator.
Google Ads continues to dominate paid search, delivering an average return of $2 for every $1 spent. With average search ad conversion rates sitting around 4.4%, a disciplined focus on bottom-funnel metrics is what separates the businesses that profit from those that just get clicks. You can explore more about these powerful PPC statistics and their impact on marketing. This data-driven approach is how you turn your advertising budget into a predictable engine for growth.
Understanding the Full Customer Journey with Attribution
Customers today almost never see a single ad and whip out their credit card. Their path to purchase is way more complicated, often weaving through multiple ads and channels before they finally decide to buy. This brings up a huge question for anyone trying to figure out if their paid search campaigns are working: which ad actually gets the credit for the conversion and the ranking boost?
This is exactly where attribution modeling steps in. Think of it as a set of rules for giving credit where credit is due, assigning value to each marketing touchpoint that helped nudge a customer toward a conversion. If you ignore attribution, you’re only seeing the very last play of the game, which can lead to some seriously misguided decisions about your ad budget.
The Soccer Team Analogy for Attribution
Imagine your marketing channels are a soccer team trying to score a goal. The striker who kicks the ball into the net gets their name in the headlines and all the glory. But did they score that goal all by themselves?
Absolutely not. A midfielder had to win the ball and deliver a perfect pass. Before that, a defender probably stopped an attack and got the ball moving up the field in the first place. If you only gave credit to the striker, you'd completely miss the value of the other players. You might even build a team of only strikers—and that team is going to lose, badly.
In paid search, the default Last-Click attribution model is like giving all the credit to that striker. It hands 100% of the conversion value to the very last ad someone clicked. While it’s simple, this model is dangerously incomplete. It totally ignores all the earlier ads and interactions that introduced the customer to your brand and walked them down the path to that final, decisive click. This is how brands fail to tell the full story of their customer's journey.
Common Attribution Models Explained
To get a clearer, more honest picture, you need to understand the different ways you can slice up the credit. Each model tells a slightly different story about your customer’s journey and your search engine strategy.
-
First-Click Attribution: This is the polar opposite of last-click. It gives all the credit to the very first touchpoint a customer had with your brand. It’s perfect for figuring out which campaigns are crushing it at generating initial awareness and pulling new people into your orbit. This model shows you which efforts are introducing your answer to new audiences (AEO).
-
Linear Attribution: This model is the diplomat of the group, splitting credit equally across every single touchpoint. If a customer saw four different ads before converting, each ad gets 25% of the credit. It’s a fair way to acknowledge that every step played a part.
-
Data-Driven Attribution (DDA): This is the brains of the operation, available in platforms like Google Ads and GA4. It uses machine learning to crunch the numbers on thousands of conversion paths, assigning credit based on how much each interaction actually influenced the final conversion. It’s the seasoned coach who sees the whole game and knows exactly who made the biggest impact.
Attribution isn't just some academic exercise; it’s a strategic tool. Picking the right model helps you accurately justify your ad spend and prove the real value of those top-of-funnel campaigns that don’t always get the final click but are absolutely essential for growth.
This infographic breaks down the typical flow, from getting eyes on an ad to making an impact on the bottom line.
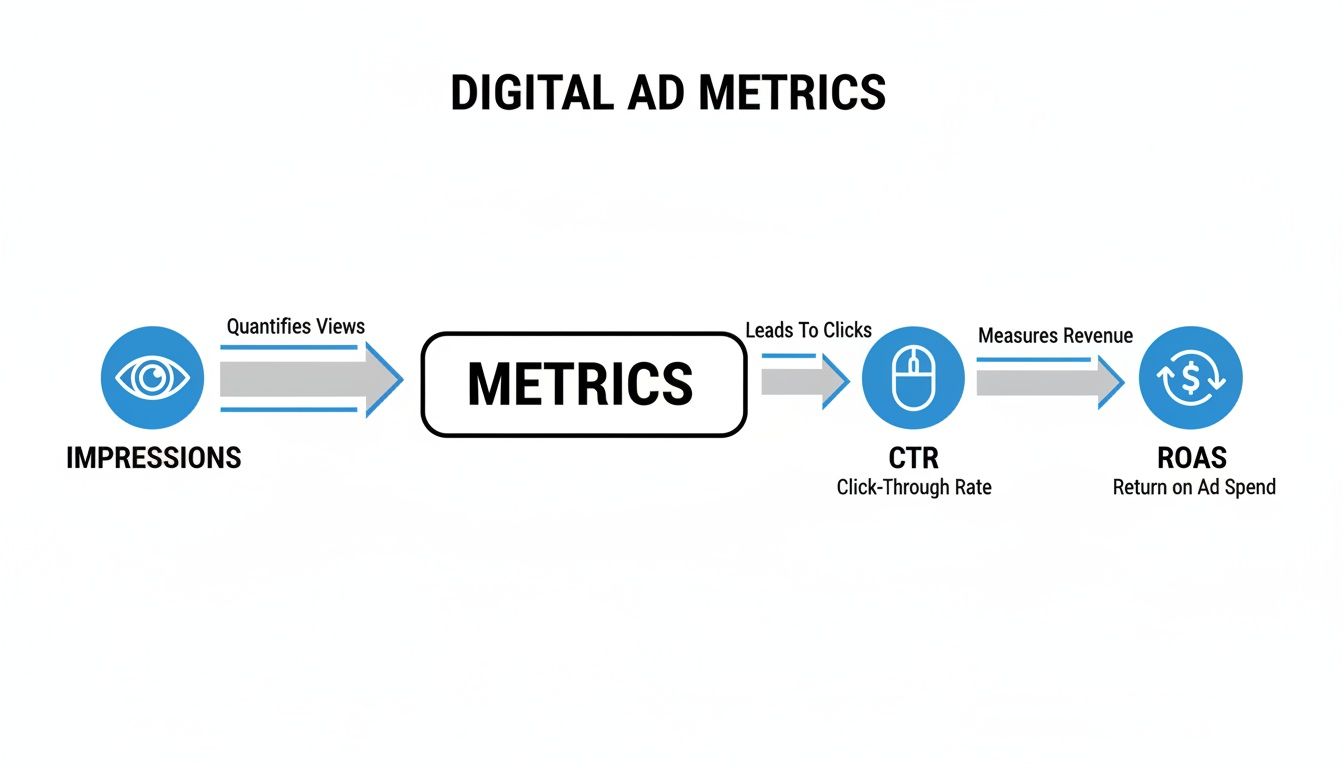
The visual shows how early interactions like impressions are needed to generate clicks (CTR), which in turn drive revenue (ROAS). It's a clear reminder of why you need to look at the entire funnel.
By moving beyond a last-click-only mindset, you can finally see how your channels are really working together. You might find out your generic search ads are fantastic at introducing new customers (First-Click), while your branded search campaigns are closers, sealing the deal (Last-Click). Both are vital, and proper attribution is what proves it.
This holistic view is the foundation if you want to truly improve marketing ROI across everything you do. With that kind of clarity, you can start optimizing your entire marketing mix—not just isolated campaigns—leading to smarter budget decisions and real, sustainable growth.
Building Actionable Dashboards That Tell a Story
All the meticulous tracking and attribution modeling in the world won't do you any good if the insights stay locked away in a spreadsheet. Raw data is just noise; it’s your job to turn that noise into a clear signal that guides your next move. This is where actionable dashboards come in.
A great dashboard does more than just display numbers. It tells a story. It should instantly answer three core business questions: "What did we spend?", "What did we get?", and "How did this impact our visibility on search engines?". This narrative approach transforms paid search analytics from a reporting task into a strategic weapon.
Moving Beyond Default Reports
Let’s be honest, the default reports in platforms like Google Ads are designed to be one-size-fits-all. That means they often fail to highlight what's truly important for your specific business. To tell a compelling story about your business's search ranking journey, you need to build a custom view that visualizes the path from ad spend to actual revenue and market presence.
Tools like Google Looker Studio (formerly Data Studio) are perfect for this. They let you pull data from different sources—like Google Ads and Google Analytics—and mash it all together in a clean, visual format. This helps stakeholders quickly spot trends, identify problems, and celebrate wins without getting bogged down in technical jargon.
The goal of a dashboard isn't to show every metric possible. It’s to show the right metrics in a way that leads to a decision. A cluttered dashboard is just as useless as a raw data file.
Designing a Simple and Effective Dashboard
Your dashboard’s design should follow a logical flow that mirrors your business funnel. By organizing your data this way, you create a visual narrative that anyone can follow, from the marketing team right up to the CEO.
A powerful dashboard structure might include:
- Top-Level Business Summary: This section answers the big-picture questions. It should feature scorecards for total spend, total conversions (leads or sales), cost per acquisition (CPA), and return on ad spend (ROAS). Think of it as the executive summary of your story.
- Performance Trends Over Time: Line charts are your best friend for visualizing performance. Plotting key metrics like conversions and CPA over the last 30 or 90 days immediately highlights your campaign’s trajectory. Is your story one of growth, decline, or stability?
- Campaign and Channel Breakdown: This is where you get into the weeds. Use a simple table or bar chart to compare the performance of different campaigns, ad groups, or keywords. This helps you quickly identify your top performers and your budget-wasters, telling you which parts of your narrative are resonating with search engines and users.
For businesses looking to turn raw data into clear, actionable insights and build impactful dashboards, consider leveraging specialized reporting and analytics services.
Tailoring Your Story for Different Businesses
The story your dashboard tells will change based on your business model. A dashboard for a local service company, for instance, should be all about lead generation and local visibility (GEO). It would prominently feature metrics like phone calls, form submissions, and cost per qualified lead.
In contrast, an online store’s dashboard would be laser-focused on sales and product visibility (AEO). It would prioritize metrics like total revenue, ROAS, and average order value. This kind of customization ensures the data is always relevant to the business's primary goals, making the insights immediately actionable and valuable.
The need for clear, robust dashboards is more critical than ever. In a recent quarter, Google search ad clicks surged to their highest level in five years, with spending jumping 13% year-over-year. As you can read in the full report on recent ad spend trends, this data highlights the immense opportunity—and risk—in the market. A well-built dashboard is your essential tool for navigating these trends, allowing you to capitalize on the click volume and turn it into predictable growth.
Paid Search Analytics: Your Questions Answered
Even when you've got a solid plan, getting into the weeds of paid search analytics is bound to bring up some questions. It happens to everyone. Let's tackle some of the most common hurdles practitioners run into so you can stay confident and keep your data-driven approach on the right track.
How Often Should I Check My Analytics?
Finding the right rhythm for checking your paid search analytics is all about balance. A quick, five-minute daily check-in on the big stuff—like spend, clicks, and conversions—is a great habit to get into. Think of it as a morning coffee check; it helps you spot any major fires, like a sudden cost spike or a broken conversion action, before they burn through your budget.
But here's the key: don't make big strategic decisions based on one day's numbers. That’s a recipe for whiplash. A more thorough weekly deep-dive is perfect for reviewing keyword performance, seeing how your ad copy tests are shaking out, and tweaking bids. Save the monthly and quarterly reviews for that 10,000-foot view, where you can spot long-term trends and map out your next big moves for ranking and visibility.
Your goal is to find a consistent cadence that keeps you in the loop without making you jump at every little daily fluctuation. Stay informed, not reactive.
What Is a Good Return On Ad Spend?
This is the million-dollar question, and the honest answer is: there's no magic number for a "good" Return On Ad Spend (ROAS). It's entirely dependent on your business's profit margins. You’ll often hear a 4:1 ratio ($4 back for every $1 spent) thrown around as a benchmark, but that can be dangerously misleading.
An e-commerce store with paper-thin margins might need a 10:1 ROAS just to stay in the black. On the flip side, a high-margin local service business, like a roofer or a cosmetic dentist, could be wildly profitable at 3:1. So, instead of chasing some generic industry average, your first move should be to calculate your own break-even ROAS. Once you know the absolute minimum you need to not lose money, you can set a realistic target that actually helps grow your bottom line.
Why Does My Google Ads Data Not Match My Analytics Data?
Seeing a mismatch between Google Ads and Google Analytics is incredibly common—so don't panic. It almost never means something is broken. The discrepancy usually boils down to one simple thing: they count conversions differently, telling slightly different stories.
- When it's counted: Google Ads typically credits a conversion to the day the ad was clicked. Google Analytics, however, credits it to the day the conversion actually happened. So if someone clicks your ad on Tuesday but doesn't buy until Thursday, Ads says "Tuesday conversion!" while Analytics says "Thursday conversion!"
- How it's counted: The platforms might also be using totally different attribution models (say, Last-Click vs. Data-Driven). This alone will guarantee the numbers never line up perfectly.
The trick isn't to force the numbers to match. It’s to understand why they're different and then pick one platform to be your official "source of truth." This gets everyone on your team looking at the same data and telling the same story, making decisions from the same playbook.
At Jackson Digital, we turn complex data into clear, actionable growth strategies. If you're ready to stop guessing and start building a predictable engine for new leads and sales, our team is here to help.